How to run the mock snmp device
The SNMP mock
The SNMP mock is an UDP server mocking a device using SNMP with a mock MIB file
(./dev/mibs/TNO-PDU-MIB.txt). It provides simulated energy values for the
following metrics: tnoPduEnergyValue and tnoPduPowerValue. This file details
how to set up the mock device, and how to subsequently run a demo with it
including both the PhysicalMeasurement and MeasurementDevice custom
resources.
Simulated values
Values are not purely random: each OID has a value, which drifts by a random amount within a set variance and stays between a lower and an upper bound. This keeps the values stable, enabling developers to debug against.
The simulation is configured with environment variables on the mock container
(see dev/k8s/snmp-mock-deployment.yaml):
| Variable | Default | Description |
|---|---|---|
MOCK_SNMP_ADDRESS |
:1161 |
Address the UDP listener binds to. |
MOCK_SNMP_VALUE_MIN |
200 |
Lower bound of the simulated value. |
MOCK_SNMP_VALUE_MAX |
800 |
Upper bound of the simulated value. |
MOCK_SNMP_VALUE_START |
500 |
Value returned on the first request for an OID. |
MOCK_SNMP_VALUE_VARIANCE |
10 |
Maximum change per request, in either direction. |
Use a different MOCK_SNMP_VALUE_START per mock deployment to tell multiple
simulated devices apart.
Requirements
Ensure you have followed the installation guidance or the instructions in How to set up the local development environment to set up a production-like or local development environment. After this:
- The cluster is running.
- The controller is running (locally via
make runor in-cluster).
Manual installation
The mock is part of the local development environment. After deploying Chantico
(which is deployed by make cluster-configure), deploy the mocks with:
This deploys the mock deployments and services for the SNMP mock (including the second SNMP device) and the VM Attribution mock (see how to run the VM Attribution mock).
Running the demo with the mock SNMP device
Querying the chantico-snmp-mock running in the development setup
If the development kind cluster is running the chantico-snmp-mock service, there is a Node Port that is visible on port 31161.
It can be queried as follow:
Chantico workflow with the snmp-mock as snmp device (full demo)
For an overview of the workflow that is run in the background in this demo please see the below image.
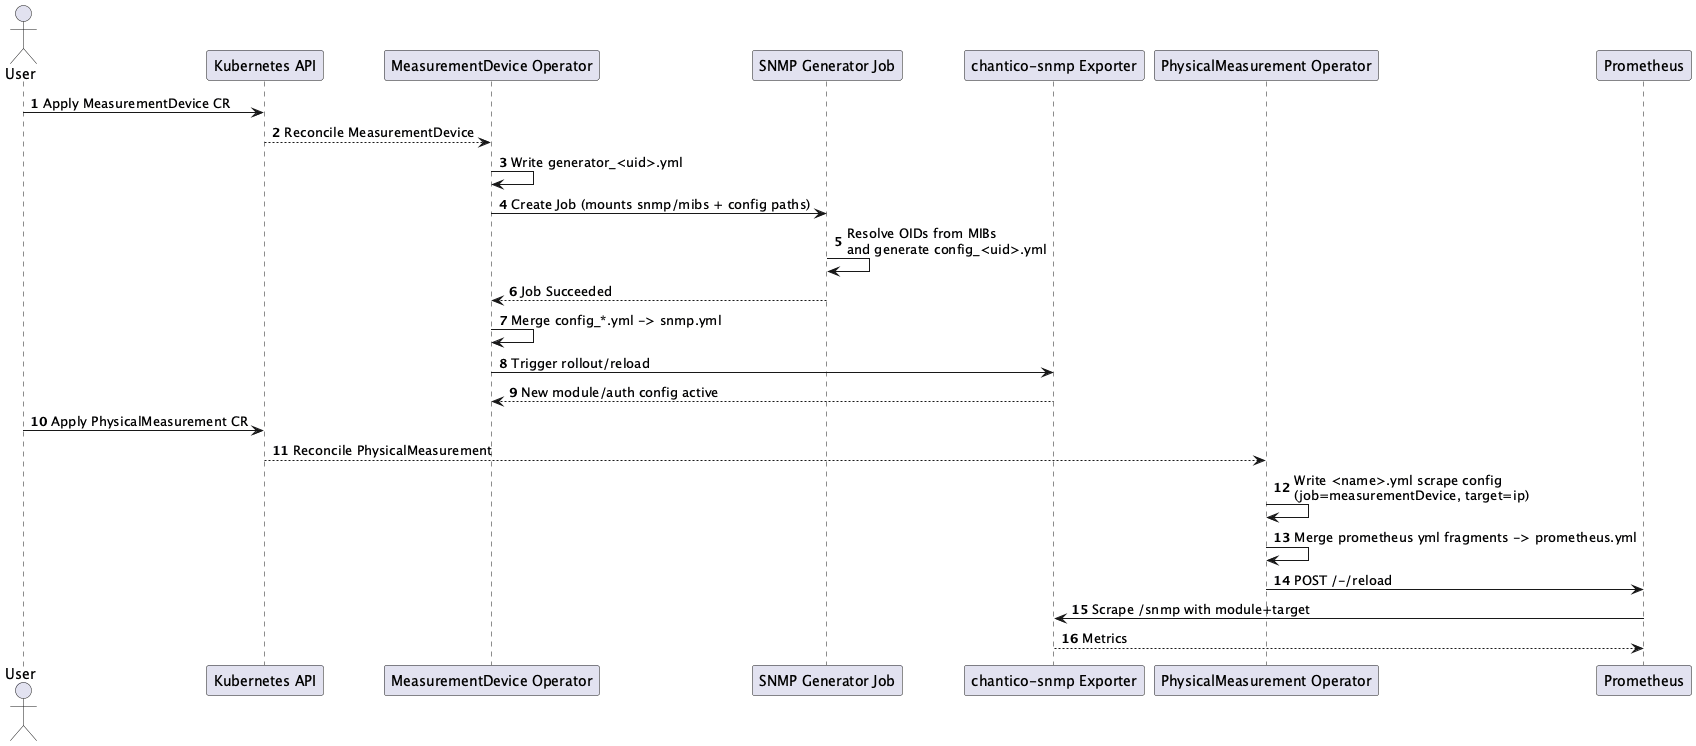
This section demonstrates a full flow: MIB upload → MeasurementDevice → PhysicalMeasurement → Prometheus targets.
- Upload the MIB file
./dev/mibs/TNO-PDU-MIB.txtto the cluster: - Create a
MeasurementDevicefor the mock MIB: - Wait for the SNMP generator job:
- Create a
PhysicalMeasurementpointing at the mock target: - Port-forward Prometheus (if not already done by the local development
environment) and verify targets:
Open http://localhost:19090/targets and verify the target is
UP.
Adding another mock snmp device
The same mock SNMP image can be deployed multiple times to simulate additional devices. Each additional device needs its own Deployment, Service, MeasurementDevice, and PhysicalMeasurement. Example manifests for a second mock device are provided in the repository.
-
Deploy the second mock SNMP agent:
-
Create a second
MeasurementDevice(can reuse the same MIB/walks, or use different ones): -
Wait for the SNMP generator job for the new device:
-
Create a second
PhysicalMeasurementpointing at the new mock target: -
Verify both targets appear in Prometheus, port-forwarding if not already done by the local development environment:
Open http://localhost:19090/targets — both the original and the new target should show as
UP.
The second mock is exposed on NodePort 31162, so you can also query it directly:
Tip: To add more devices beyond the second, copy the mock-2 manifests, update the names (e.g.
chantico-snmp-mock-3), pick a free NodePort, and create correspondingMeasurementDevice/PhysicalMeasurementresources. Prometheus will automatically pick up new targets viafile_sd_configs— no restart required.
Adding baremetal resources and linking them to the mock SNMP device
To demonstrate the full workflow, you can also create a DataCenterResource representing a baremetal resource and link it to the mock SNMP device. This makes it possible to aggregate metrics from the SNMP devices together into the data center resource, store the metrics in VictoriaMetrics and visualize them in Grafana.
To do so, you can apply the following manifest:
If all the resources are created correctly, you should see the following when querying the resources in the chantico namespace on your cluster:
Additionally, you can verify in Prometheus that the metrics are being scraped from the mock SNMP devices and aggregated into the DataCenterResource metrics. These will show up in the “Rule health” section as the following rules containing the subsequent metrics:
- chantico_datacenterresource_pdu1
chantico_power_watts{resource="datacenterresource-pdu1", type="pdu"}
- chantico_datacenterresource_pdu2
chantico_power_watts{resource="datacenterresource-pdu2", type="pdu"}
- chantico_datacenterresource_misd_gbm_01
chantico_power_coefficient{child="datacenterresource-misd-gbm-01", parents="datacenterresource-pdu1}chantico_power_coefficient{child="datacenterresource-misd-gbm-01", parents="datacenterresource-pdu2}chantico_power_watts{resource="datacenterresource-misd-gbm-01", type="baremetal"}
You can query these metrics from Prometheus for the recent data of the specific time series. You can also visualize these metrics in Grafana by visiting the pre-configured “Chantico” dashboard.